

Monitoring of research activity
Check the step of your projects by visualizing the time required to complete each chemical reaction and well as the time of inactivity elapsed between them.
Inspect the time line of your projects
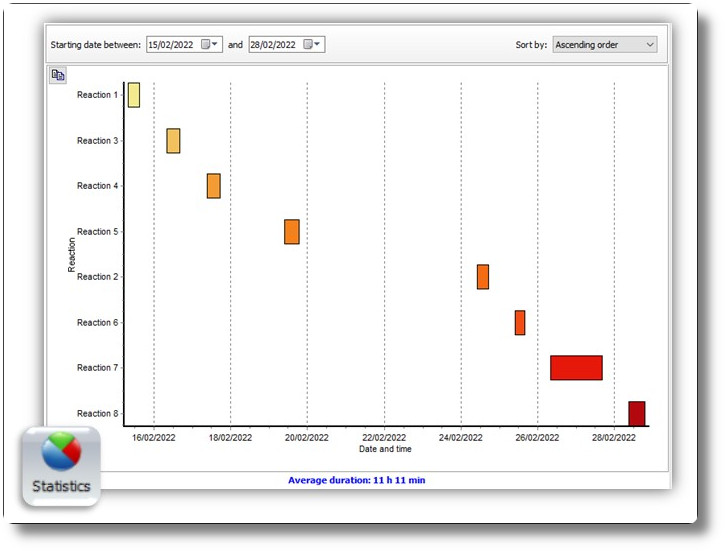
Consult the Gantt charts of your lab sessions to see the progress of your projects. Plot the charts for the time periods and sorting modes that you wish.
- Detect the chemical reactions that demanded more dedication
- Compare the duration of different lab sessions
- Gain insights into the workflow intensity
- Uncover periods of inactivity
- Calculate the average duration of your lab sessions