

Recording and automated analysis of optimization tests
Record the outcomes of your optimization arrays to store them, inspect their improvements visually and support them with automated advanced statistics.
Store complete optimization tables
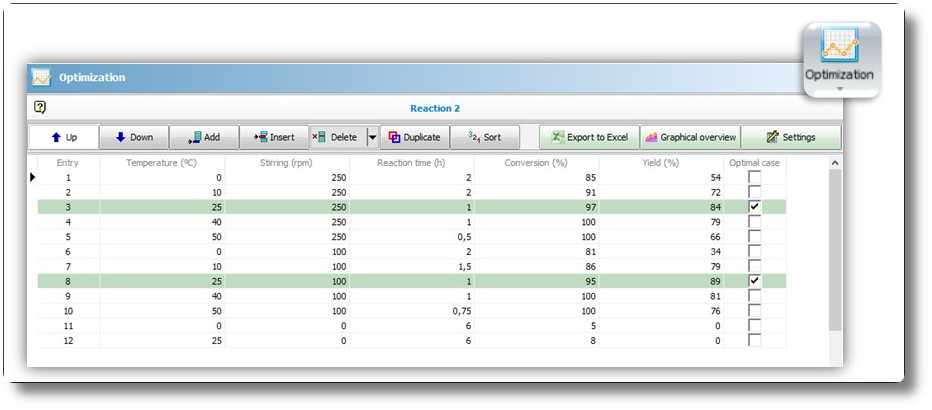
Register your optimization work into clear and fully tunable tables.
- Add as many entries as you need and highlight the optimal one/s
- Choose all the variables that you evaluated experimentally, as well as the outcome measures
- Sort and manipulate entries to gain better insights
- Export it to Microsoft Excel spreadsheets
- Obtain automatic graphical overviews and statistical analyses
- Customize the table as you wish
Analyze the progress of the optimization
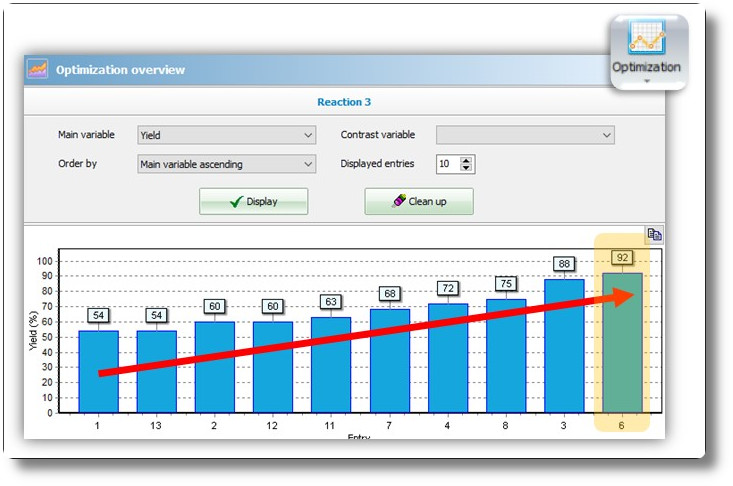
Compare in an easy and visual way the step of the optimization process.
- Distinguish which entries are associated to the best system performances
- Analyze the evolution of each variable (either dependent or independent)
- Quickly sort the optimization outcomes
Find variables correlationsthroughout the optimization
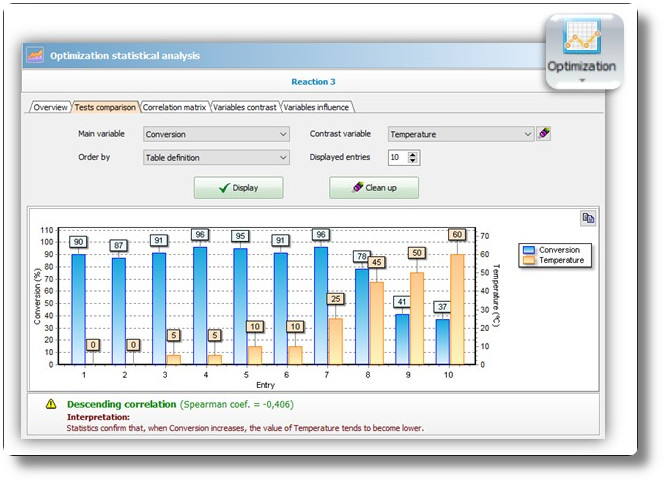
Evaluate the behaviour of any dependent variable in contrast to the evolution of other independent variables.
- Inspect visually which is the impact of an independent variable (e.g. temperature) increase with respect to a particular outcome (e.g. yield)
- Infer the correlation degree between the two variables through the Spearman coefficient
- Decide whether to carry out further experimental tests depending on the global evolution
Infer the importance of the variables
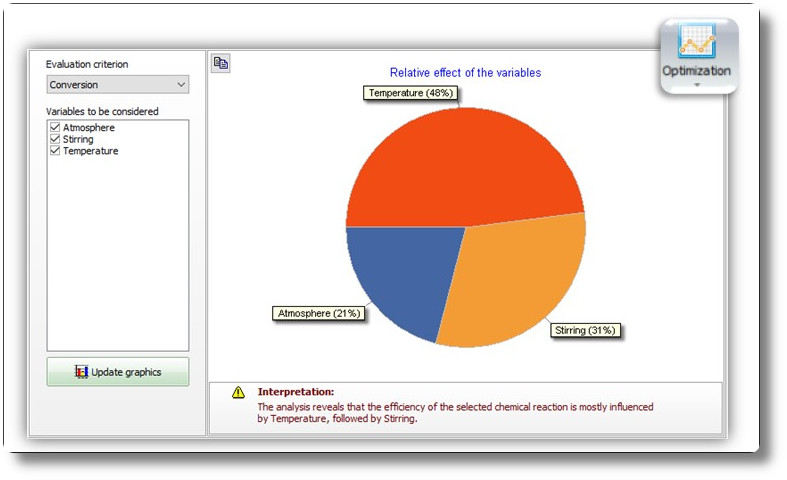
Take advantage of the Machine Learning techniques included in ORCOD to quantify the importance of the variables evaluated in the optimization process and to plan future tests.
The importance reflects how strong is the effect of a particular variable (e.g. Temperature, atmosphere, stirring, etc.) with regards to a specific output (e.g. Yield, conversion, reaction time, etc.).
Obtain automated statistical analyses
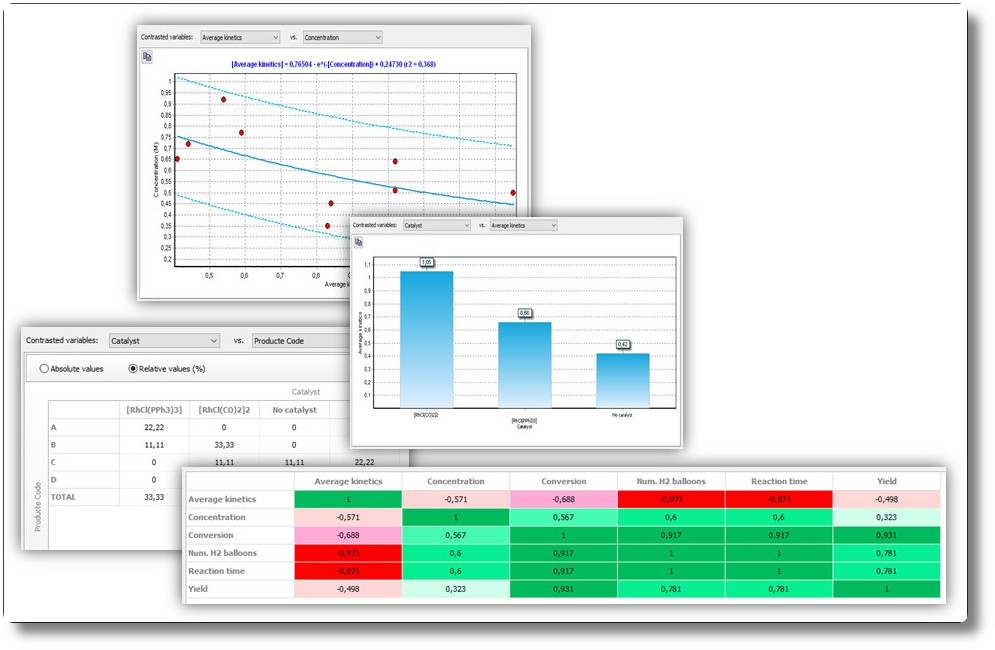
Supply your optimization data and obtain instant descriptive statistical analyses.
- Contrast the variables among them to prepare scatter plots, bar charts or contingency tables. Just pick the variables that you wish to contrast and the software will present the most convenient analysis.
- Consult the correlation matrix to inspect which variables are most correlated among them.