

Extraction of project statistics
Get a general and objective overview of the reactions and compounds defined in your projects. Inspect the relevant statistical data of your work to plan the next steps.
Get global graphical insights into several reactions features
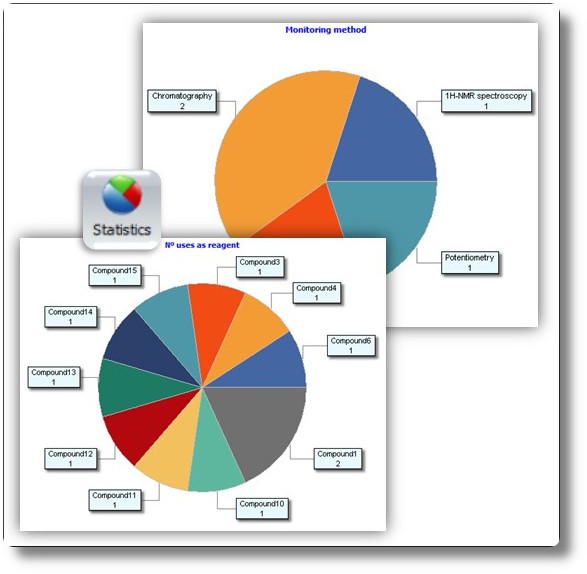
Inspect easily the global features of the reactions defined in your scheme and uncover statistical data.
- Which are the most frequent monitoring and purification methods
- Which compounds are mostly used as reagents and/or products
- Which researchers have participated more in the project Which organization and projects constitute the scheme
Get global graphical insights into several reactions performances
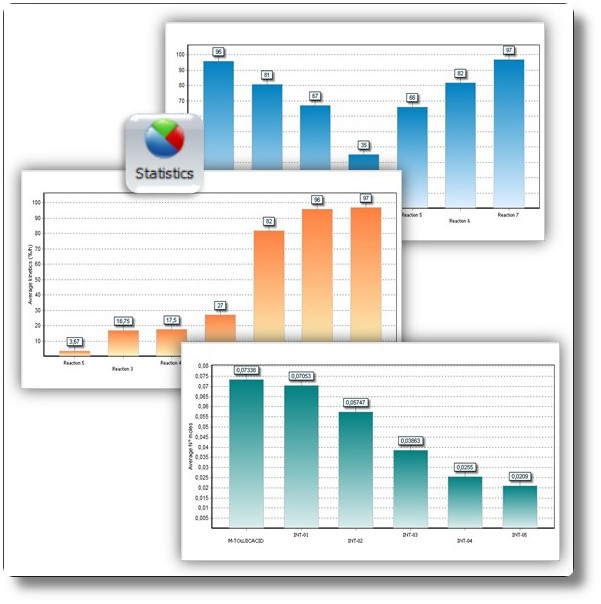
Inspect easily the global performance of the reactions defined in your scheme and uncover statistical data.
- Which reactions are associated to the highest yields, reaction durations and kinetics
- Which compounds are linked to the highest yields, reaction durations and kinetics
- Which are the reagents and products associated purities
- Which mass and number of moles are generally employed
- Which costs are associated to the reactions sequences
Get statistical summaries for reactions outcomes
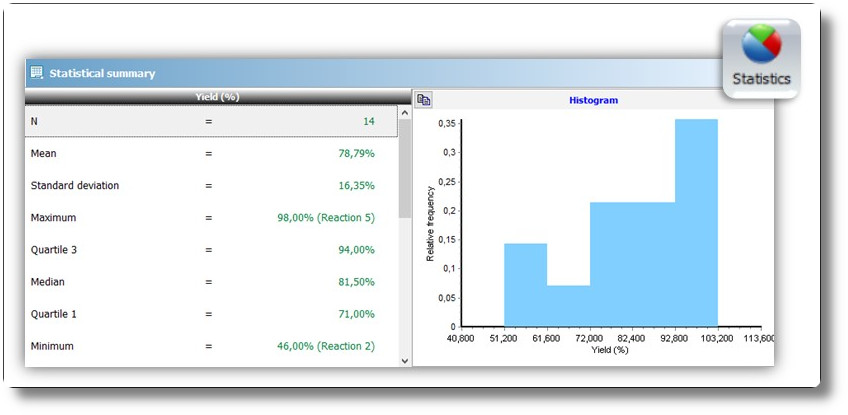
Pick up any quantitative variable and obtain useful statistical information across the reactions defined in your scheme.
- Mean and standard deviation
- Median and quartiles
- Maximum and minimum
- Global and interquartile range
- Asymmetry and kurtosis coefficients
- Histogram
Uncover the background trends of your results
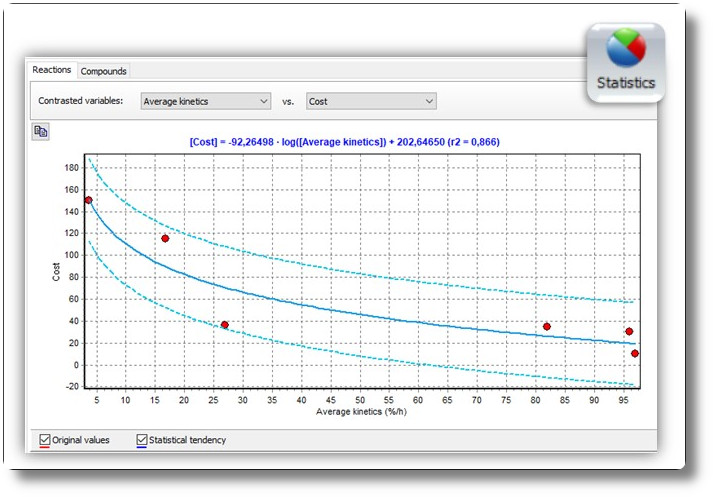
After recording the experimental results, take a look at the Bivariant analysis and learn how your data tends to evolve thanks to AutoML techniques.
- Contrast all the variables of your project among them
- Discover intrinsic behaviours
- See whether your variables are linearly or non-linearly correlated
- Let the software automatically infer the most likely evolution pattern